 eAtlas Data Catalogue
University of Tasmania
Type of resources
Topics
Keywords
Contact for the resource
Provided by
Years
Update frequencies
status
-

This record provides an overview of the NESP Marine and Coastal Hub small-scale study - "National Assessment of Climate-Driven Species Redistribution using Citizen Science Data ". For specific data outputs from this project, please see child records associated with this metadata. This project will develop a report card assessing Australian marine species to determine species that have undergone recent changes in distribution, either shifting into each state, or into new areas within states. This report card will draw upon citizen science databases (Redmap, iNaturalist, Reef Life Survey) and use a robust decision tree analysis to outline which species are shifting, and with what degree of certainty. Project objectives are to 1. draw upon citizen scientists to identify climate-driven changes within the Australian marine estate; and 2. communicate to and engage with the public on issues of climate change and biodiversity using their own citizen science information. The report card can be used to drive public interest in the NESP MAC Hub and in the status of biodiversity in Australia. Outputs • Summary data indicating the list of species that have undergone a range shift. This will record the old southern range, an updated old range based on new compiled historic data and the new range. [Spreadsheet dataset] • Species Assessment report with analysed data and a short summary of recommendations for policy makers of key findings [written]
-
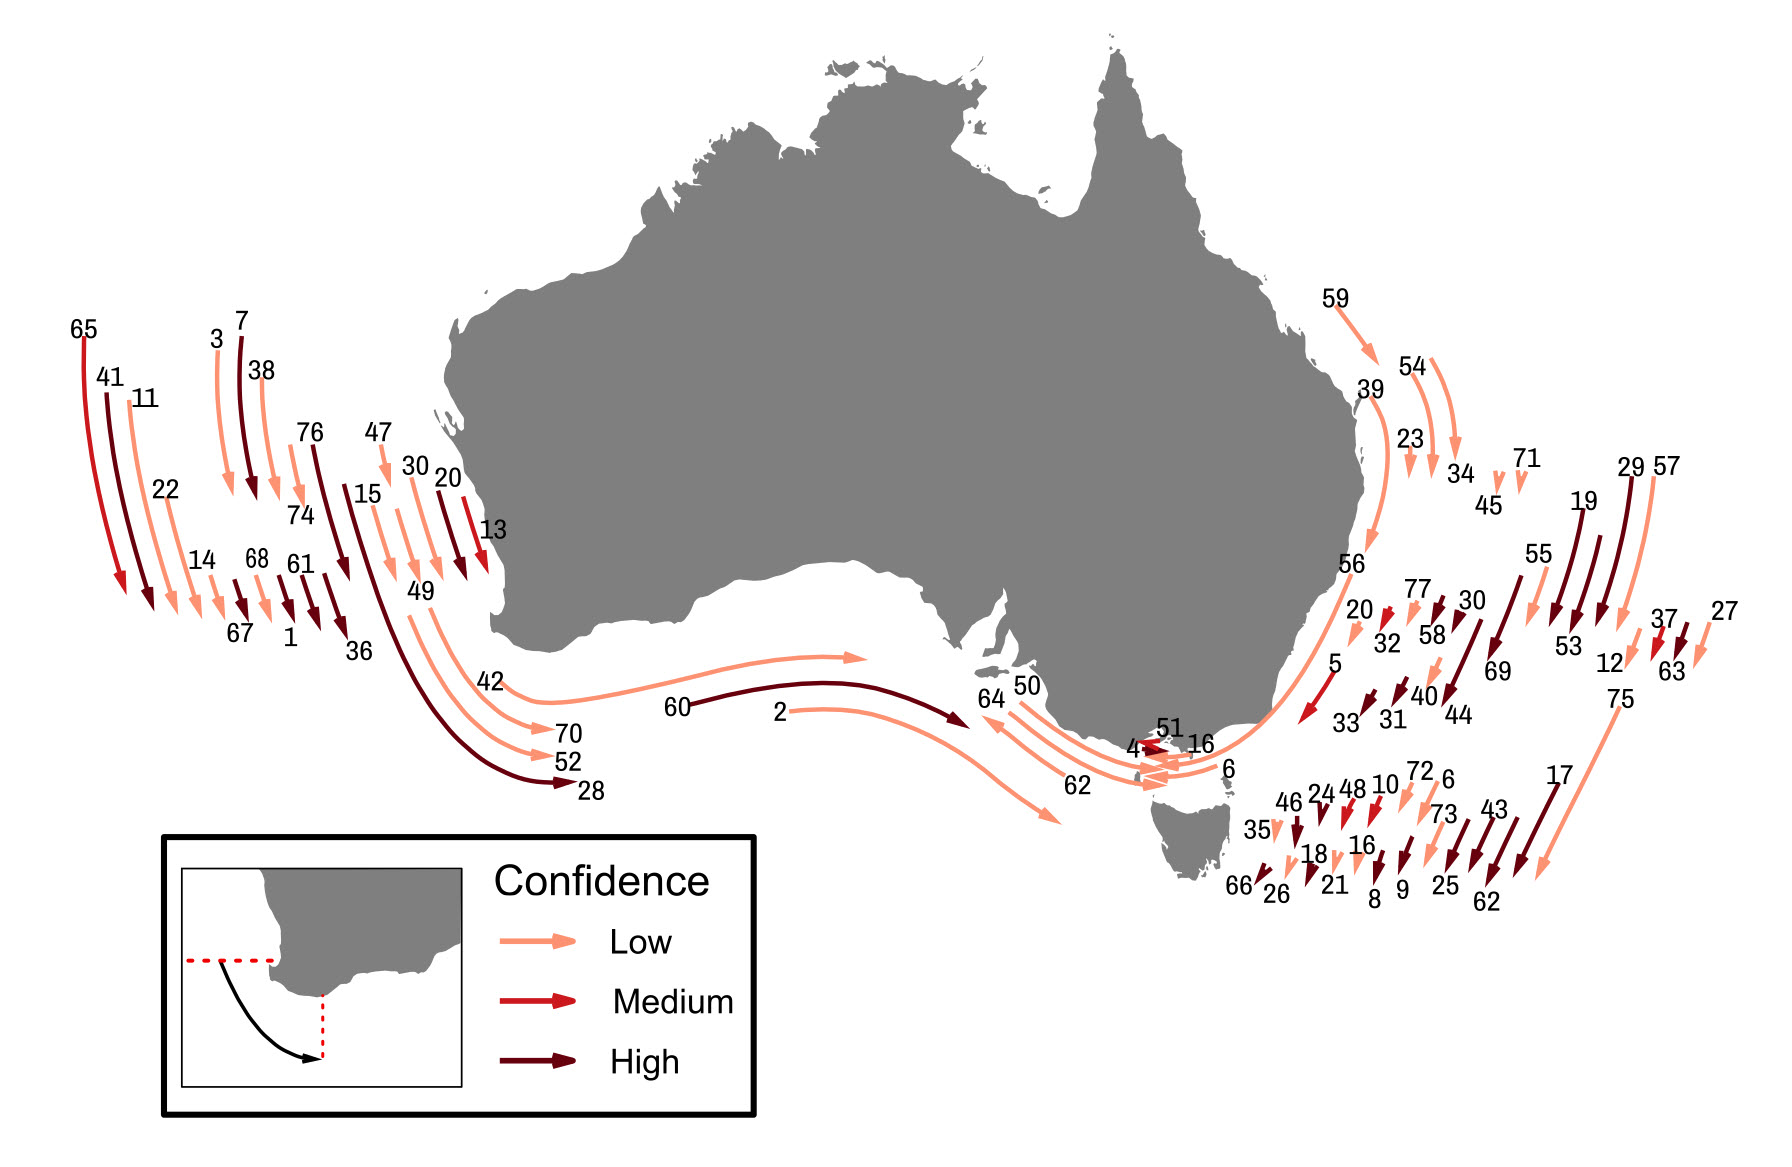
This dataset consists of the historical range limits and poleward-most extent of recent extralimital occurrence of 82 potential marine species’ range extensions around Australia (NSW, QLD, SA, TAS, VIC and WA) revealed by an assessment of citizen scientists observations from Redmap, Reef Life Survey, and iNaturalist from 2013–2022. The purpose of this project was to assess evidence for climate-driven marine species range extensions with data provided by Australian citizen scientists. While there are at least 198 documented range shifts of marine species in the scientific literature, there are large gaps in our ability to formally monitor changes in species distributions both geographically and across taxonomic groups that citizen scientists (beachcombers, divers, fishers, snorkelers, etc.) can help resolve. This assessment had two main components: Establish historical poleward range limits for each of 200 target species tracked by Redmap (up to the year 2012); and assess the evidence for extralimital occurrence of each species in the subsequent decade across three citizen science databases (Redmap, Reef Life Survey, iNaturalist). Confidence of species range extension occurring was qualitatively estimated (high, medium, or low) based on species traits (e.g., mobility, detectability) and strength of evidence provided by citizen science data (e.g., evidence of overwintering, multi-year detections). These results provide an early indication of species and regions where more focused monitoring or research effort may be warranted. These findings were developed into report cards for dissemination to both demonstrate the value of citizen science and engage with the public on climate change and marine biodiversity, using their own information. Methods: This assessment had two main components: 1) Establish historical poleward range limits up to the year 2012 for each of 200 target species; and 2) assess the evidence for extralimital occurrence of each species in the subsequent decade across three citizen science databases (Redmap, Reef Life Survey, iNaturalist). Confidence of species range extension occurring was qualitatively estimated (high, medium, or low) based on species traits (e.g., mobility, detectability) and strength of evidence provided by citizen science data (e.g., evidence of overwintering, multi-year detections). These methods were a modified version of the Robinson et al. (2015) framework developed through a workshop process in November 2021. The assessment target species list consisted mainly of species on the Redmap (Range Extension Database and Mapping project) target list and a select opportunistic additions, totalling 200 species. Species historical poleward range limits were established up to the year 2012 from both distributional references such as Australian Faunal Directory (AFD, ABRS 2009) and Australian National Expert Fish Distributions (https://researchdata.edu.au/australian-national-fish-expert-distributions/671428) and a review of available raw occurrence data (Atlas of Living Australia, pre-2013 citizen science observations of target species, etc.) to document the poleward-most known occurrences of each target species. Species for which there was uncertainty regarding taxonomy or historical distribution limits that would have a bearing on assessment results were excluded from the assessment. A 20 km buffer was added on to range limits to reduce artifact from range limits established to low precision. Citizen science observations of target species up to February 2022 were accessed from iNaturalist Australasian Fishes project, Redmap, and Reef Life Survey (via the Australian Ocean Data Network). iNaturalist records underwent additional verification by species experts, and as Reef Life Survey data does not formally have photographic evidence associated with it, these data were only used in a corroboratory role for species for which extralimital observations from the other citizen science databases were available. Confidence of potential range extensions evidence by extralimital observations was estimated qualitatively based on detections across multiple years and for non-highly-mobile species, evidence of overwintering (during the coldest months of the year on either coast). Detectability, due to rarity, small size and/or cryptic colouration/behaviour was also taken into consideration. To summarise the extent of each assessed range extension, the assessed historical range limit and the most out-of-range observation were identified for each species and collated in this data set. Locations represent latitudes, or on the south coast, longitudes. Limitations of the data: These data only represent the latitudes (or longitudes on the south coast) of species range limits (as of 2012) and recent extralimital observations rather than precise coordinates. These results only reflect the assessment of 200 target species and not an exhaustive list of marine species range extensions to the present or those reflected in the citizen science databases. Not all assessed extralimital observations indicate a species is undergoing a geographical range extension (see confidence estimates) Format of the data: The dataset consists of a table with 82 instances of potential marine species range extensions noted by the latitude (or longitude, on the south coast) of historical range limits and extent of recent observations. Data dictionary: - #: Corresponds to alphabetical ordered species, and the numbers on the preview map. - Species name: Species scientific name. - State: state(s) along which potential range extension occurred (to distinguish disparate extensions of the same species, e.g. on both east and west coasts). - Confidence in range extension: qualitative estimate that out-of-range observations represent an ongoing range extension produced by the assessment. - Historical distribution limit: latitude (or longitude on the south coast) of the species’ poleward known distributional limit as of 2012. - New extent: latitude (or longitude on the south coast) of new poleward-most extent provided by citizen science observations of the species from 2013-2022. - Distance (km): latitudinal (or longitudinal, insofar as inferred to be occurring along the south coast) distance between historical distribution limit and new extent, in kilometres. - Notes: “adults” indicates range extensions of adult life stages only (i.e., into areas where juveniles were previously known to occur). eAtlas Processing: The original data were provided as a csv file with a png map and preview image (jpg). No modifications to the underlying data were performed and the data package are provided as submitted. Location of the data: This dataset is filed in the eAtlas enduring data repository at: data\\custodian\2021-2022-NESP-MaC-1\1.30_Climate-driven-species-redistribution